


Bitcoin (BTC) continued to circle $86,000 on Tuesday as US stock markets hit fresh all-time highs.
Key points:
- Bitcoin attempted to move toward $87,000 but faces ongoing friction from ask liquidity clustered around this key level.
- US stock markets returned to all-time highs, with the S&P 500 Index adding 0.8% to reach 7,835 points.
- BTC price analysis saw the 21-day simple moving average (SMA) at $83,500 as nearby key support.
Bitcoin rangebound as S&P 500, Nasdaq see new highs
Data from TradingView showed BTC/USD attempting to return to $87,000 after another failed attempt to break higher on Monday.
BTC/USD one-hour chart. Source: Cointelegraph/TradingView

Stocks were in focus after the Wall Street open as the S&P 500, Nasdaq 100 and tech-heavy Nasdaq Composite Index hit new record highs of 7,835, 31,312 and 27,683 points, respectively.
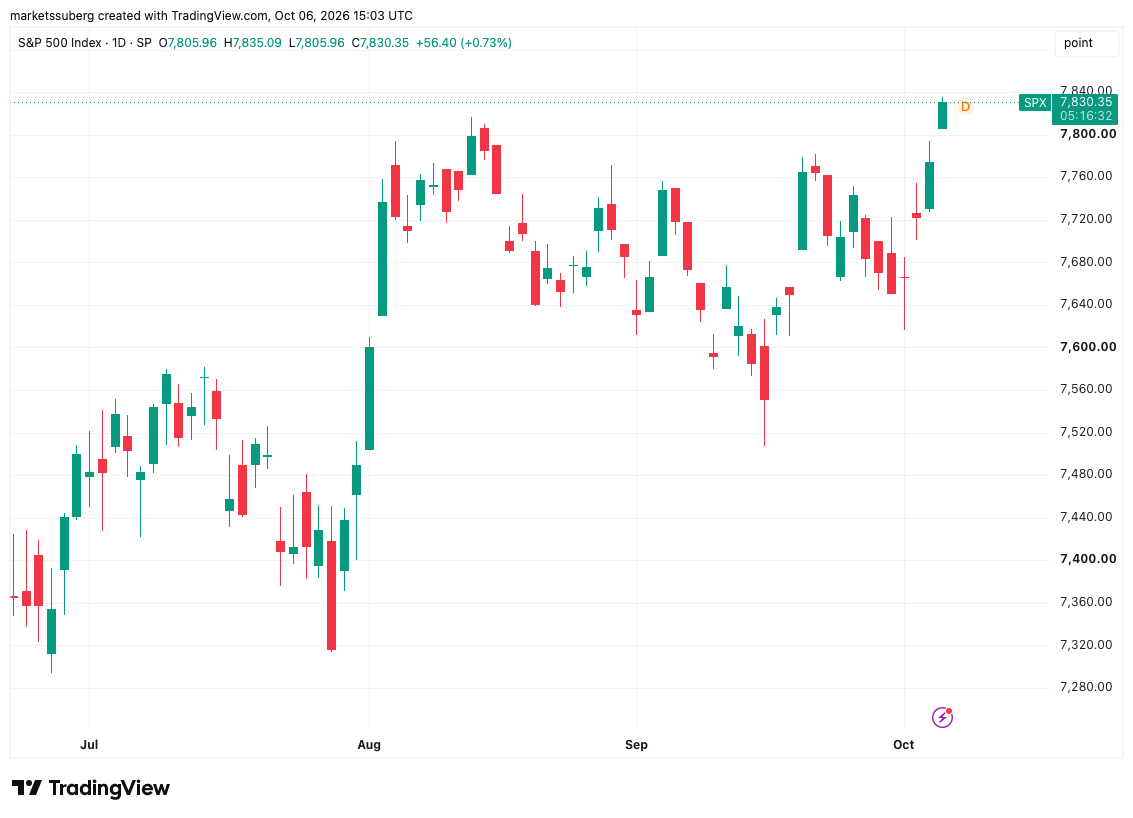
S&P 500 one-day chart. Source: Cointelegraph/TradingView
Commenting on the move, trading resource The Kobeissi Letter noted that the S&P 500 had added 24%, or $71.3 trillion, in value since March 30.
In new analysis looking at the outlook for stocks, Mosaic Asset Company suggested that cooling expectations of interest-rate hikes from the Federal Reserve in Q4 2026 could propel markets higher.
“Shifting views around the Fed and a slower pace of rate hikes could become the catalyst for a durable rally,” it summarized on Tuesday.
Mosaic reiterated that stock-market breadth remained near its lowest levels in six months, with just 25% of stocks trading above their 50-day simple moving average (SMA) last week. Tech companies supplied the lion’s share of the latest upside.
“Breadth has been this oversold just one other time this year, which was back in late March as the S&P 500 fell near correction territory. Oversold conditions helped spark a reversal back then, and could do so again,” it commented.
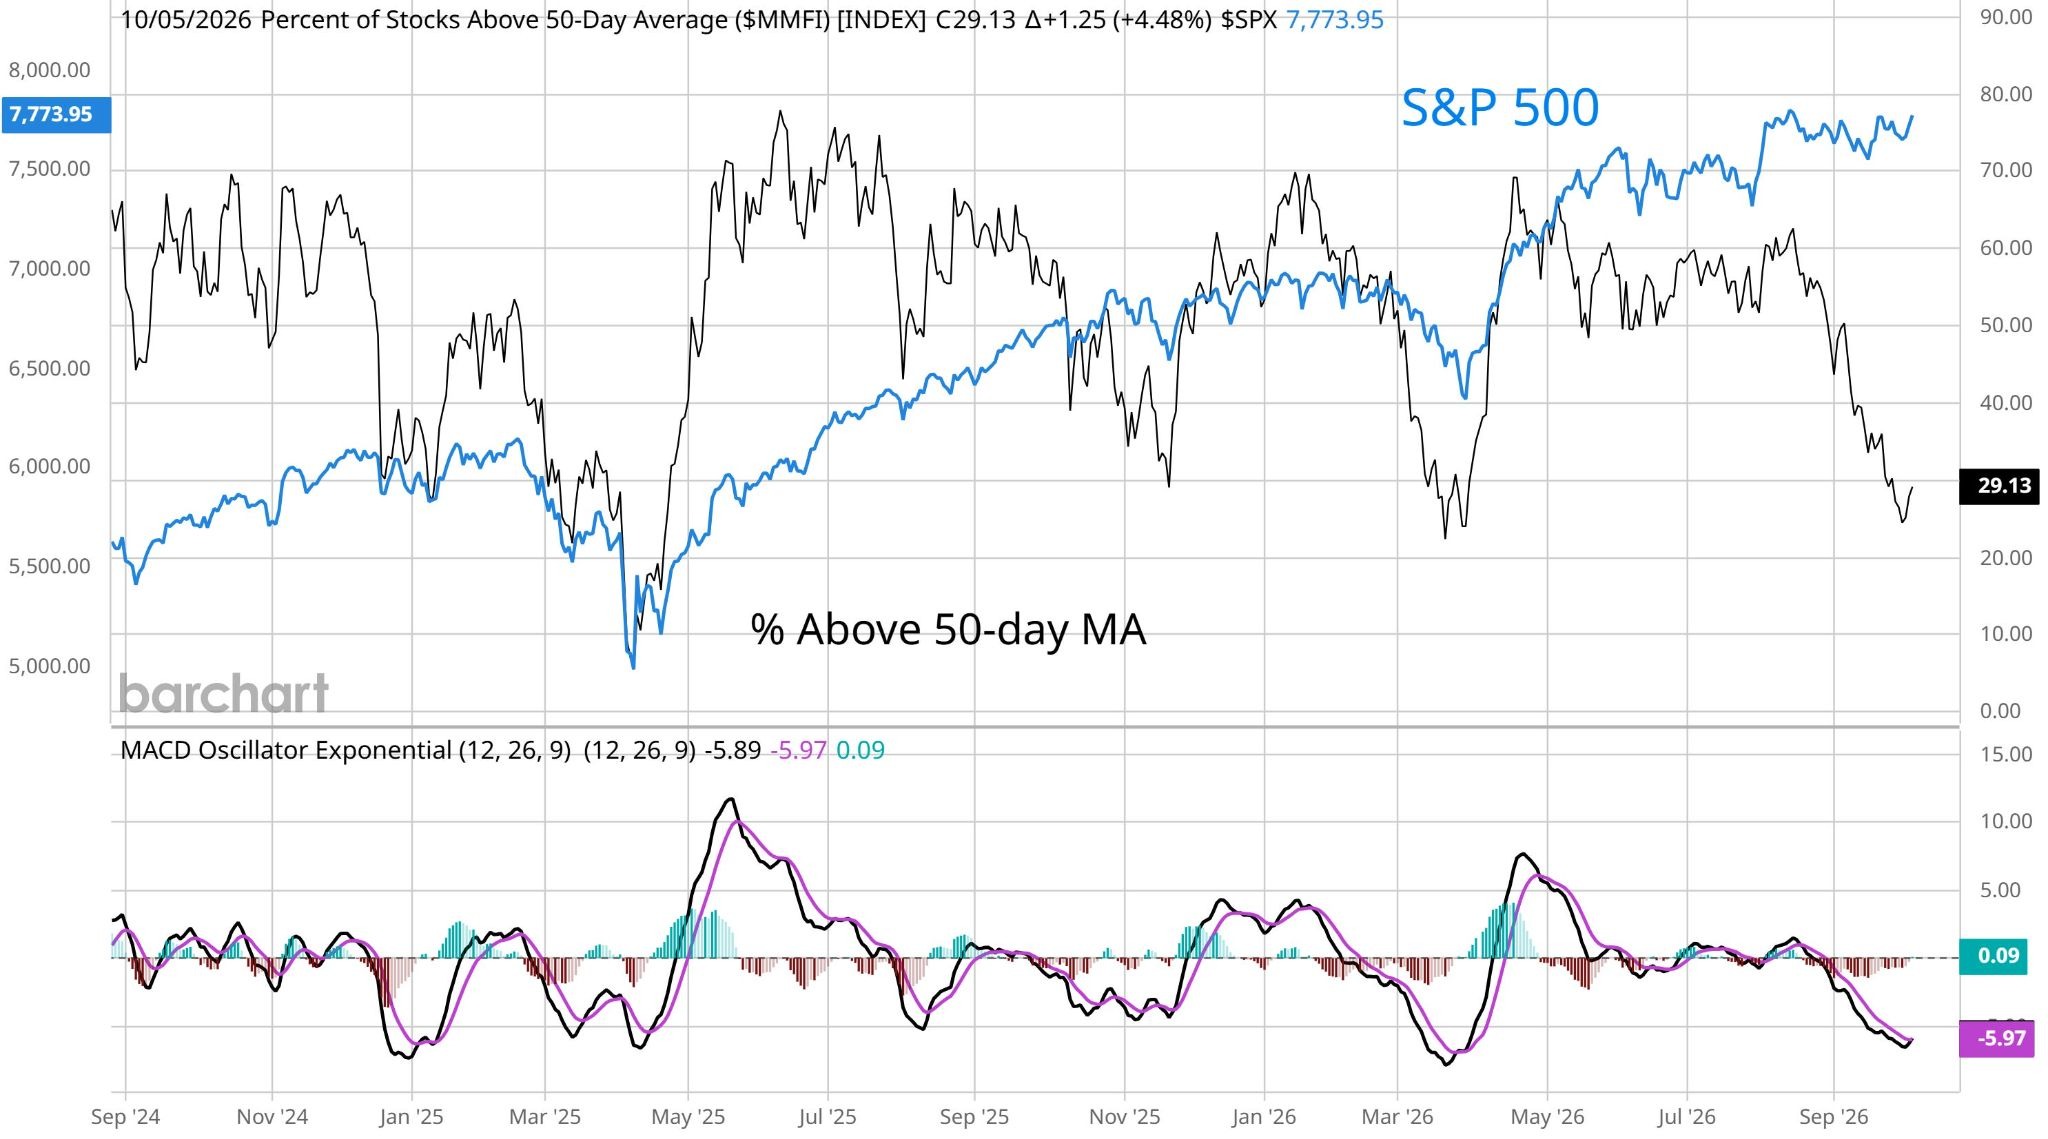
S&P 500 stocks trading above 50-day SMA. Source: Mosaic Asset Company
Data from onchain analytics platform CryptoQuant shows a modest positive correlation between Bitcoin and the S&P 500. It currently sits at 0.51 as of Oct. 2, its highest since early June.
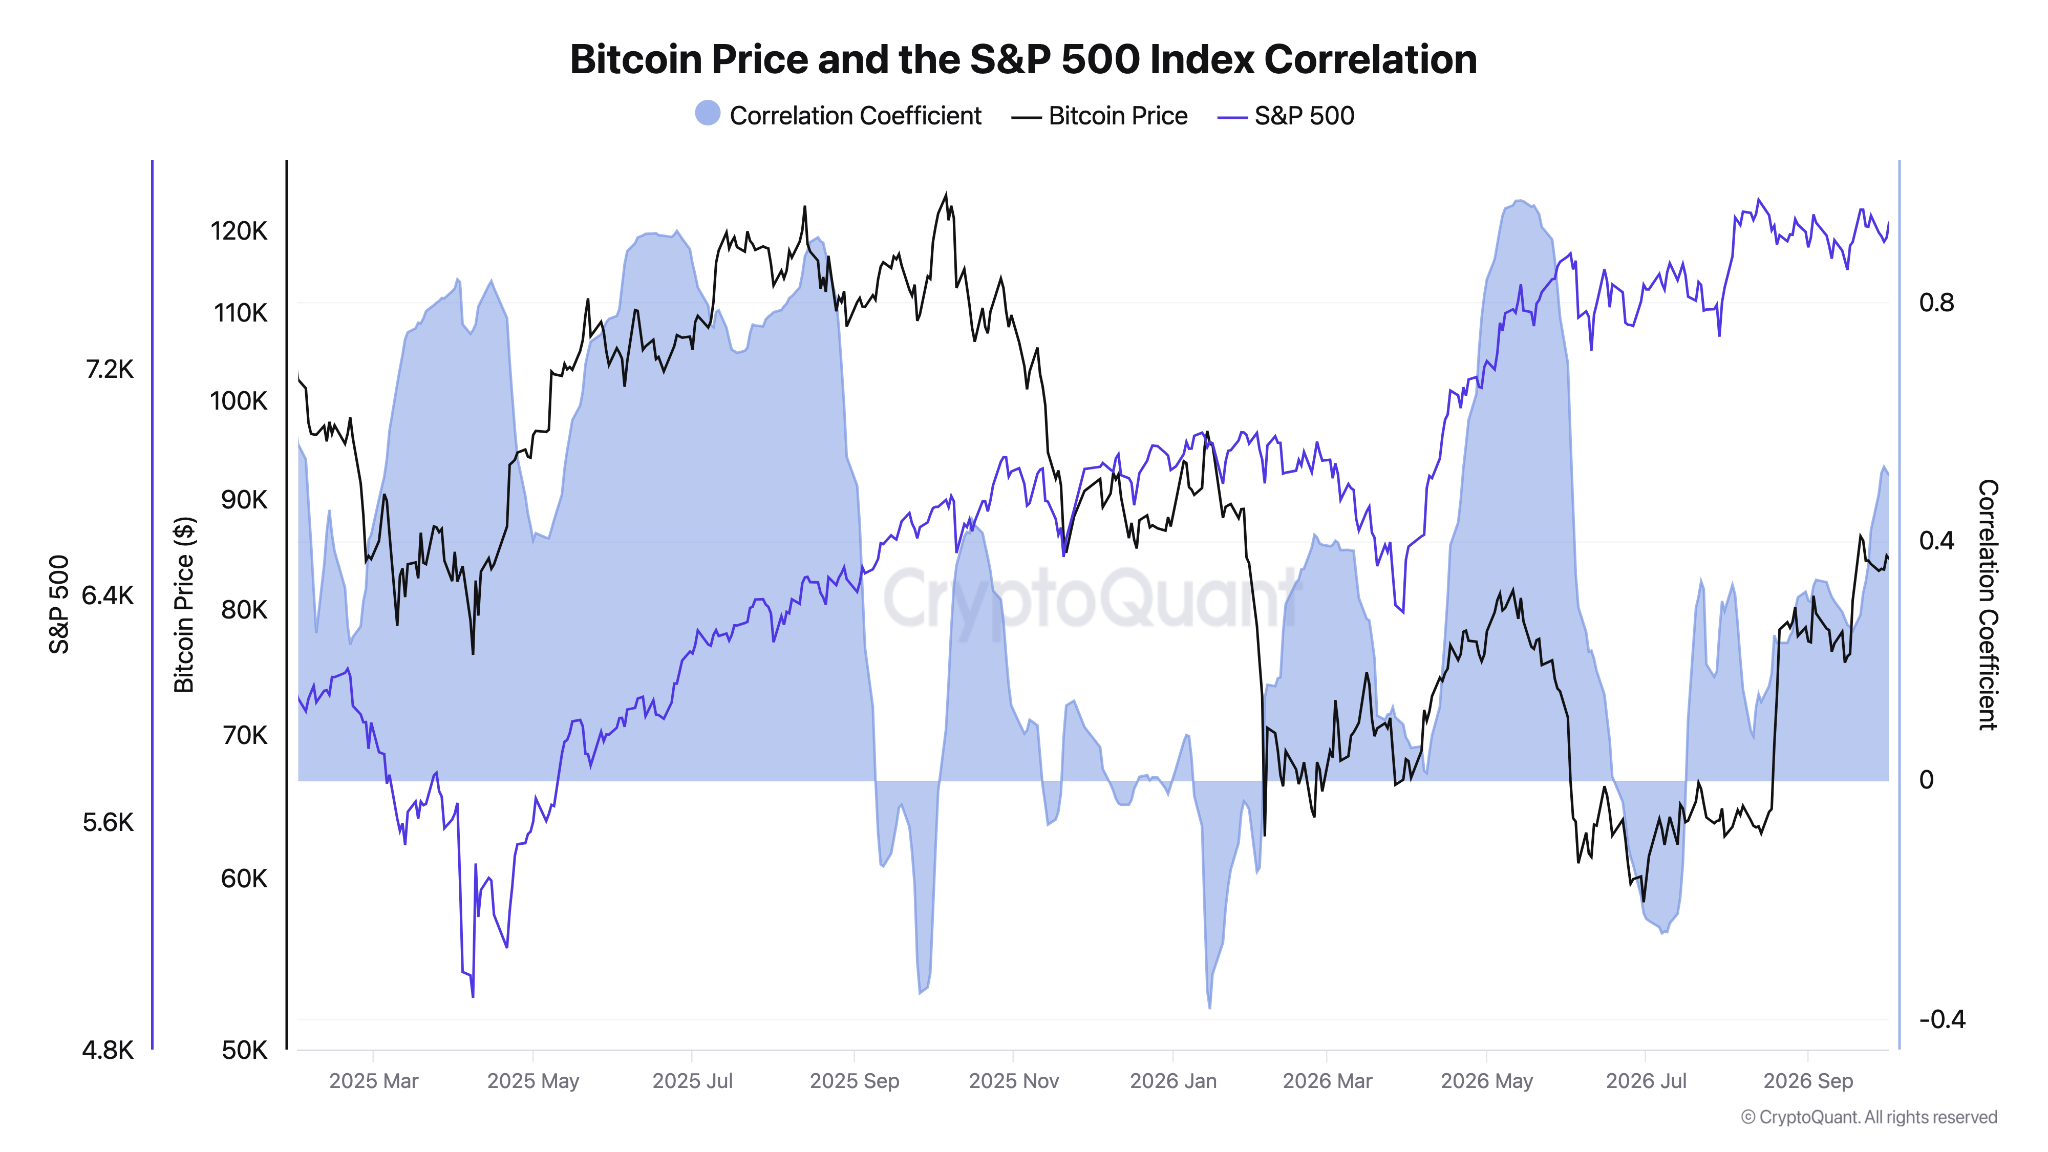
BTC/USD vs. S&P 500 correlation. Source: CryptoQuant.
BTC price support hinges on 21-day trend line
BTC price action continued to face overhead resistance near range highs thanks to ask liquidity on exchange order books.
Related: Binance BTC outflows hit highest since mid-2023 as whales deposit stablecoins
Data from CoinGlass showed the largest concentration of liquidity around $87,000 on Tuesday. A “ladder” of asks extended down to $86,500, likely contributing to capped price upside.
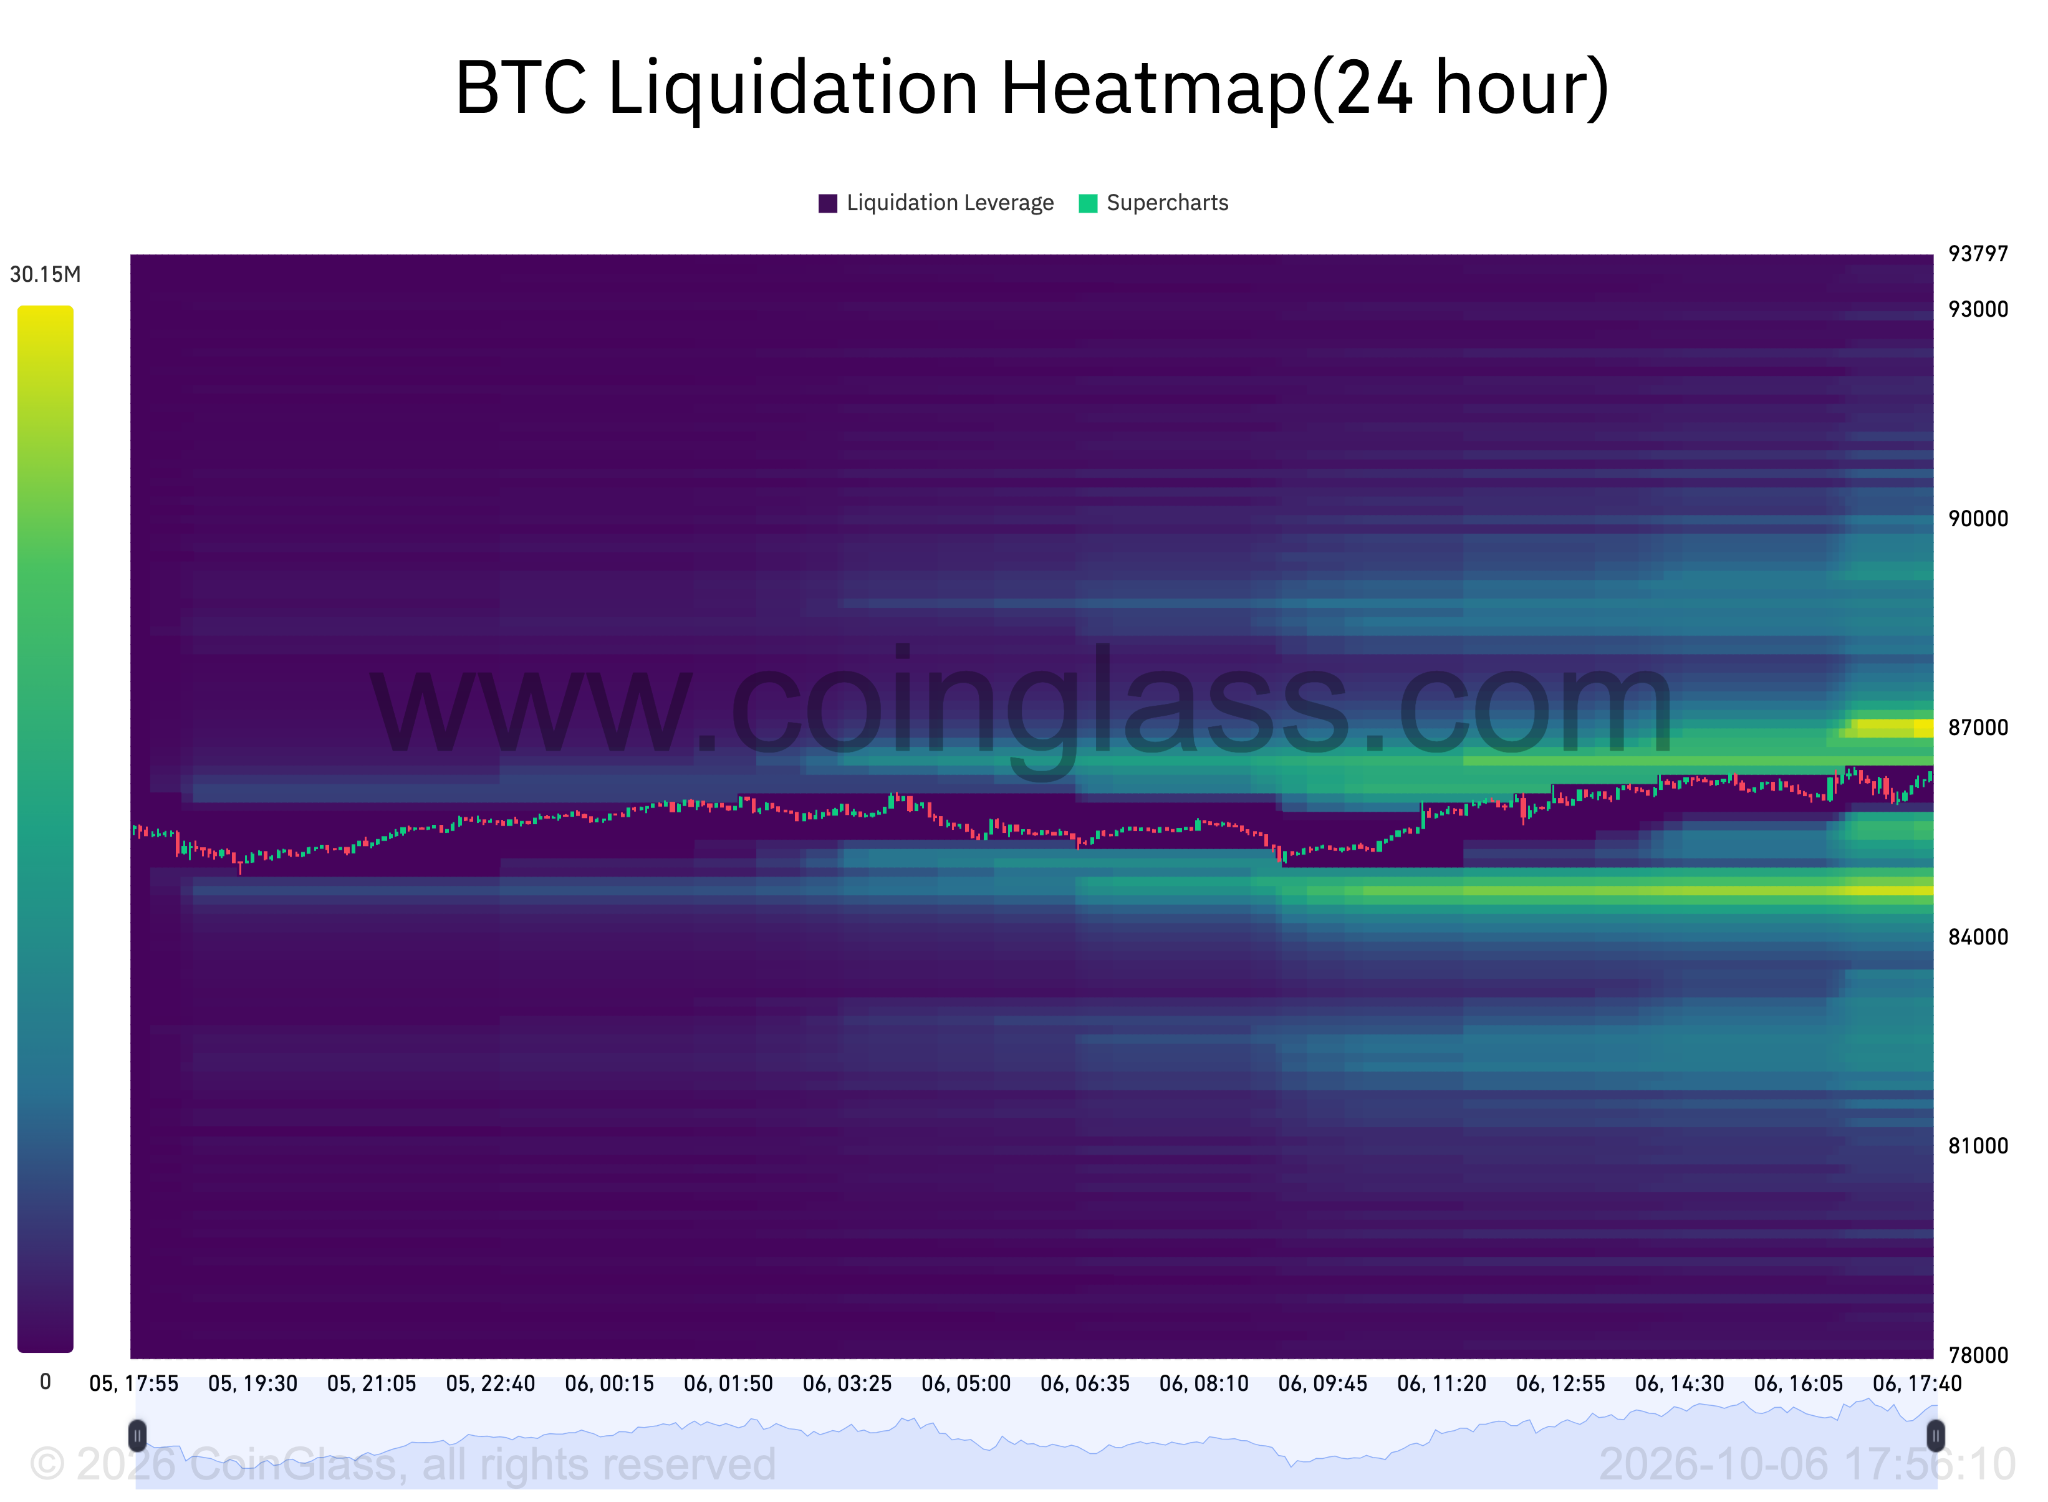
BTC liquidation heatmap. Source: CoinGlass
In his latest market overview on X, Keith Alan, cofounder of crypto trading suite Material Indicators, identified support at $83,500, Bitcoin’s current 21-day SMA. This level was last traded on Sept. 18.
“I’m watching price around $83,555, the structure of any $82,500 support test, and whether buyers can clear the Monthly signal’s $87,375 invalidation threshold,” Alan wrote in analysis on Oct. 1.
“Beyond that, a reclaim and successful retest of the Yearly Open at $87,496 would strengthen my case for a durable move above $91,540 which would act as another validation of a confirmed bull market.”
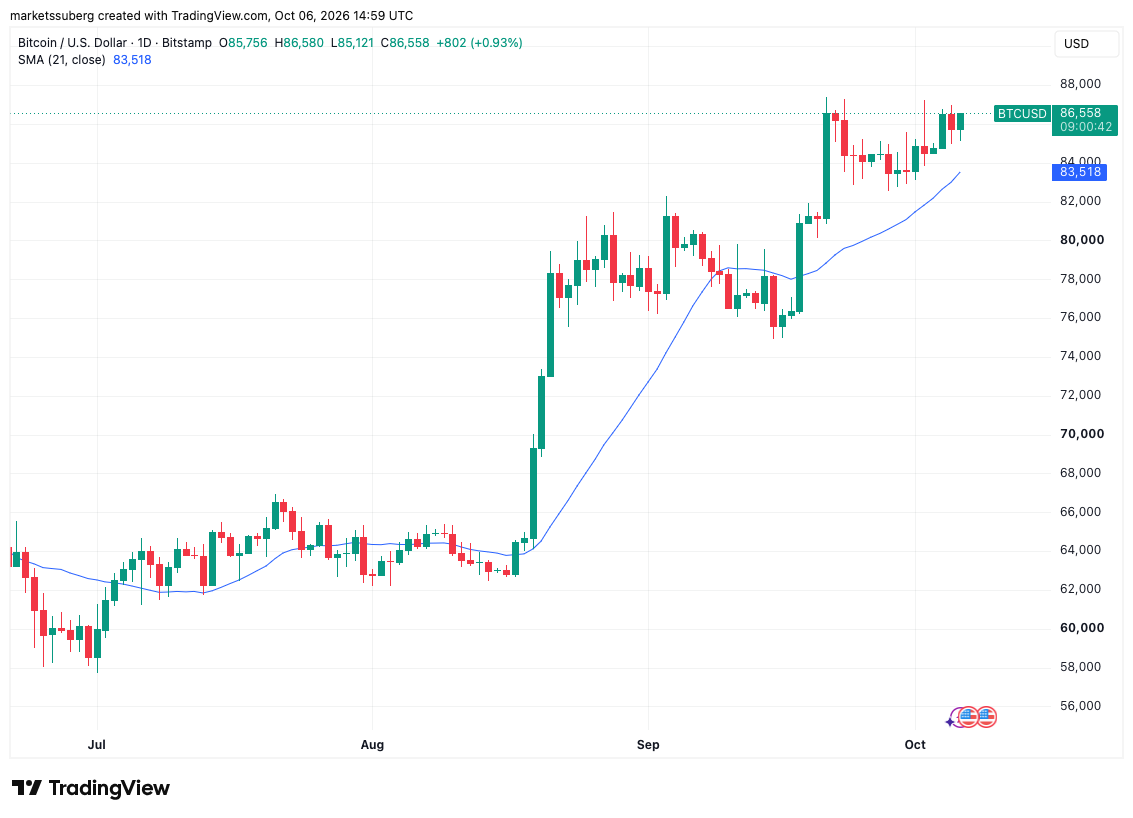
BTC/USD one-day chart with 21 SMA. Source: Cointelegraph/TradingView