


Bitcoin (BTC) dipped below $80,000 on Thursday as US Producer Price Index (PPI) data significantly beat expectations.
Key points:
- Bitcoin briefly traded below $80,000 on the back of a 100-basis-point overshoot in US PPI inflation data.
- September PPI measured 6.3% against market expectations of 5.3%, the biggest monthly jump since March 2022.
- BTC price analysis saw the potential for a “volatile retest” of trend lines around $78,000 next.
Biggest PPI increase since March 2022 adds to Bitcoin tailwinds
Data from TradingView showed BTC/USD slipping to its lowest levels since Sept. 18, declining as much as 1.8% on the day, before rebounding to around $81,000.

BTC/USD one-hour chart. Source: Cointelegraph/TradingView
September PPI came in at 6.3%, a full 100 basis points above its anticipated level, while core PPI rose to 5% versus an expected 4.4%, per data from the Bureau of Labor Statistics (BLS).
“The September increase is the largest advance since rising 1.7% in March 2022. On an unadjusted basis, the index for final demand climbed 6.3% for the 12 months ended in September, the largest 12-month increase since moving up 6.4% in December 2022,” an official news release confirmed.
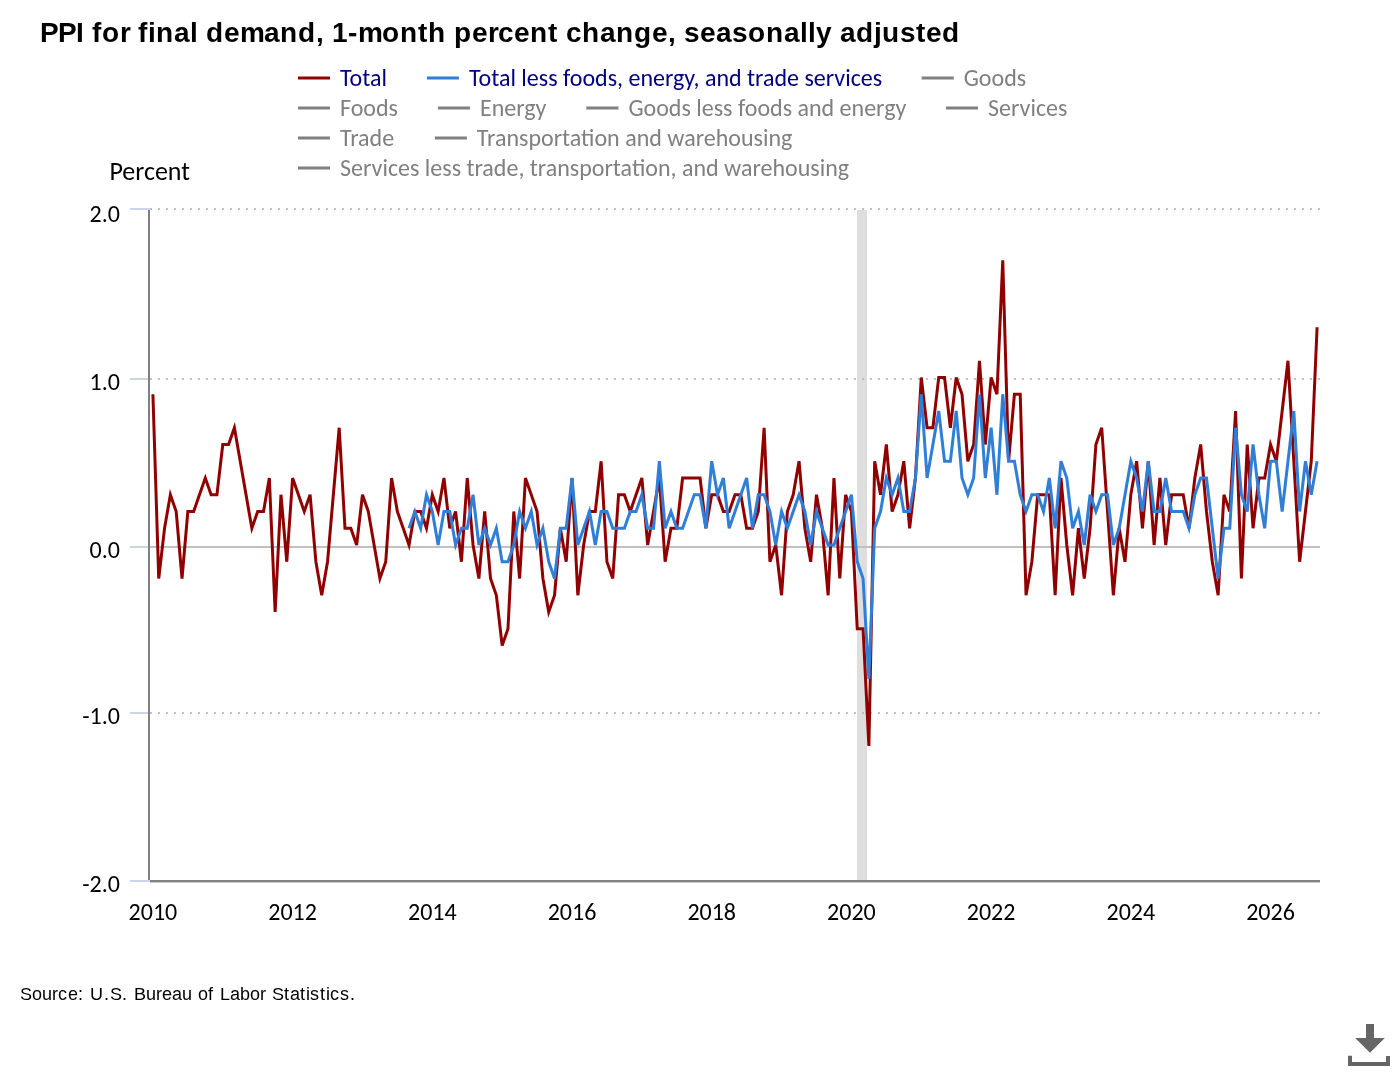
US PPI one-month % change. Source: BLS
The numbers come a day after the Consumer Price Index (CPI) also overshot estimates, causing crypto and risk assets to fall. Risk assets were already under pressure from a tech sell-off centered in South Korea, where the KOSPI Composite Index fell 7.5% on Thursday.
Economist Mohamed El-Erian described PPI as “even more striking” than the CPI result. El-Erian and others noted that US bond yields were not rising on the back of higher inflation numbers. The US 10-year bond yield was down almost 3% at the time of writing, at its lowest levels since Sept. 23.
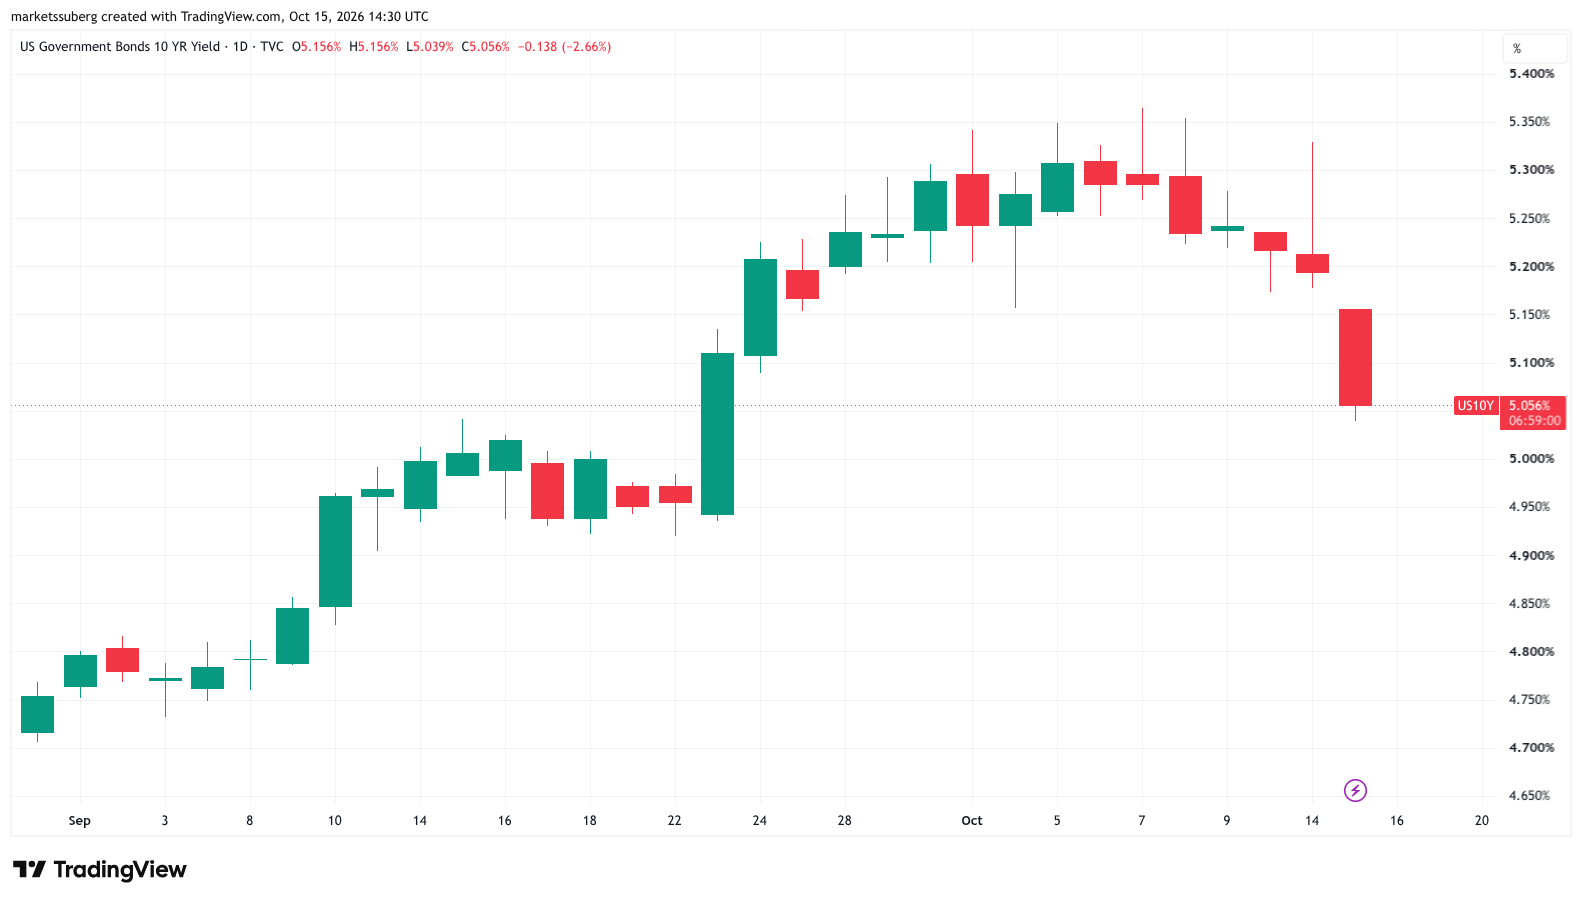
US 10-year bond yield one-day chart. Source: Cointelegraph/TradingView
Robin Brooks, former chief FX strategist at Goldman Sachs, repeated earlier findings which suggested that yields had “decoupled” from US macro data as market priorities switched to the government’s handling of the federal budget deficit.
Brooks compared the 30-day correlation between upside data surprises and daily moves in the 10-year yield, and revealed that it had dropped from near 0.6 earlier in 2026 to just below zero as of the end of August.
“That indicates that yields have decoupled from data and the obvious explanation for this is that markets are more focused on the trajectory of the deficit, so they’re pushing up longer-term yields regardless of what data surprises are doing,” he summarized in a blog post last month.
Analysis eyes “early-stage bull market” support retest
BTC price action meanwhile brought two support trend lines back into focus: the 21-week and 50-week exponential moving averages (EMA) at $76,144 and $78.459, respectively.
Related: CryptoQuant’s 3 charts keeping Bitcoin’s ‘Uptober’ thesis valid
Trader and analyst Rekt Capital noted that BTC/USD could still retest both and preserve its overall bullish trend.
“Deviating below them on a volatile retest to find a pullback bottom has historically happened in early-stage Bull Markets. These deviations however would occur after a bullish crossovers of these two EMAs, whereas Bitcoin is still pre-crossover,” Rekt Capital said in an X post.
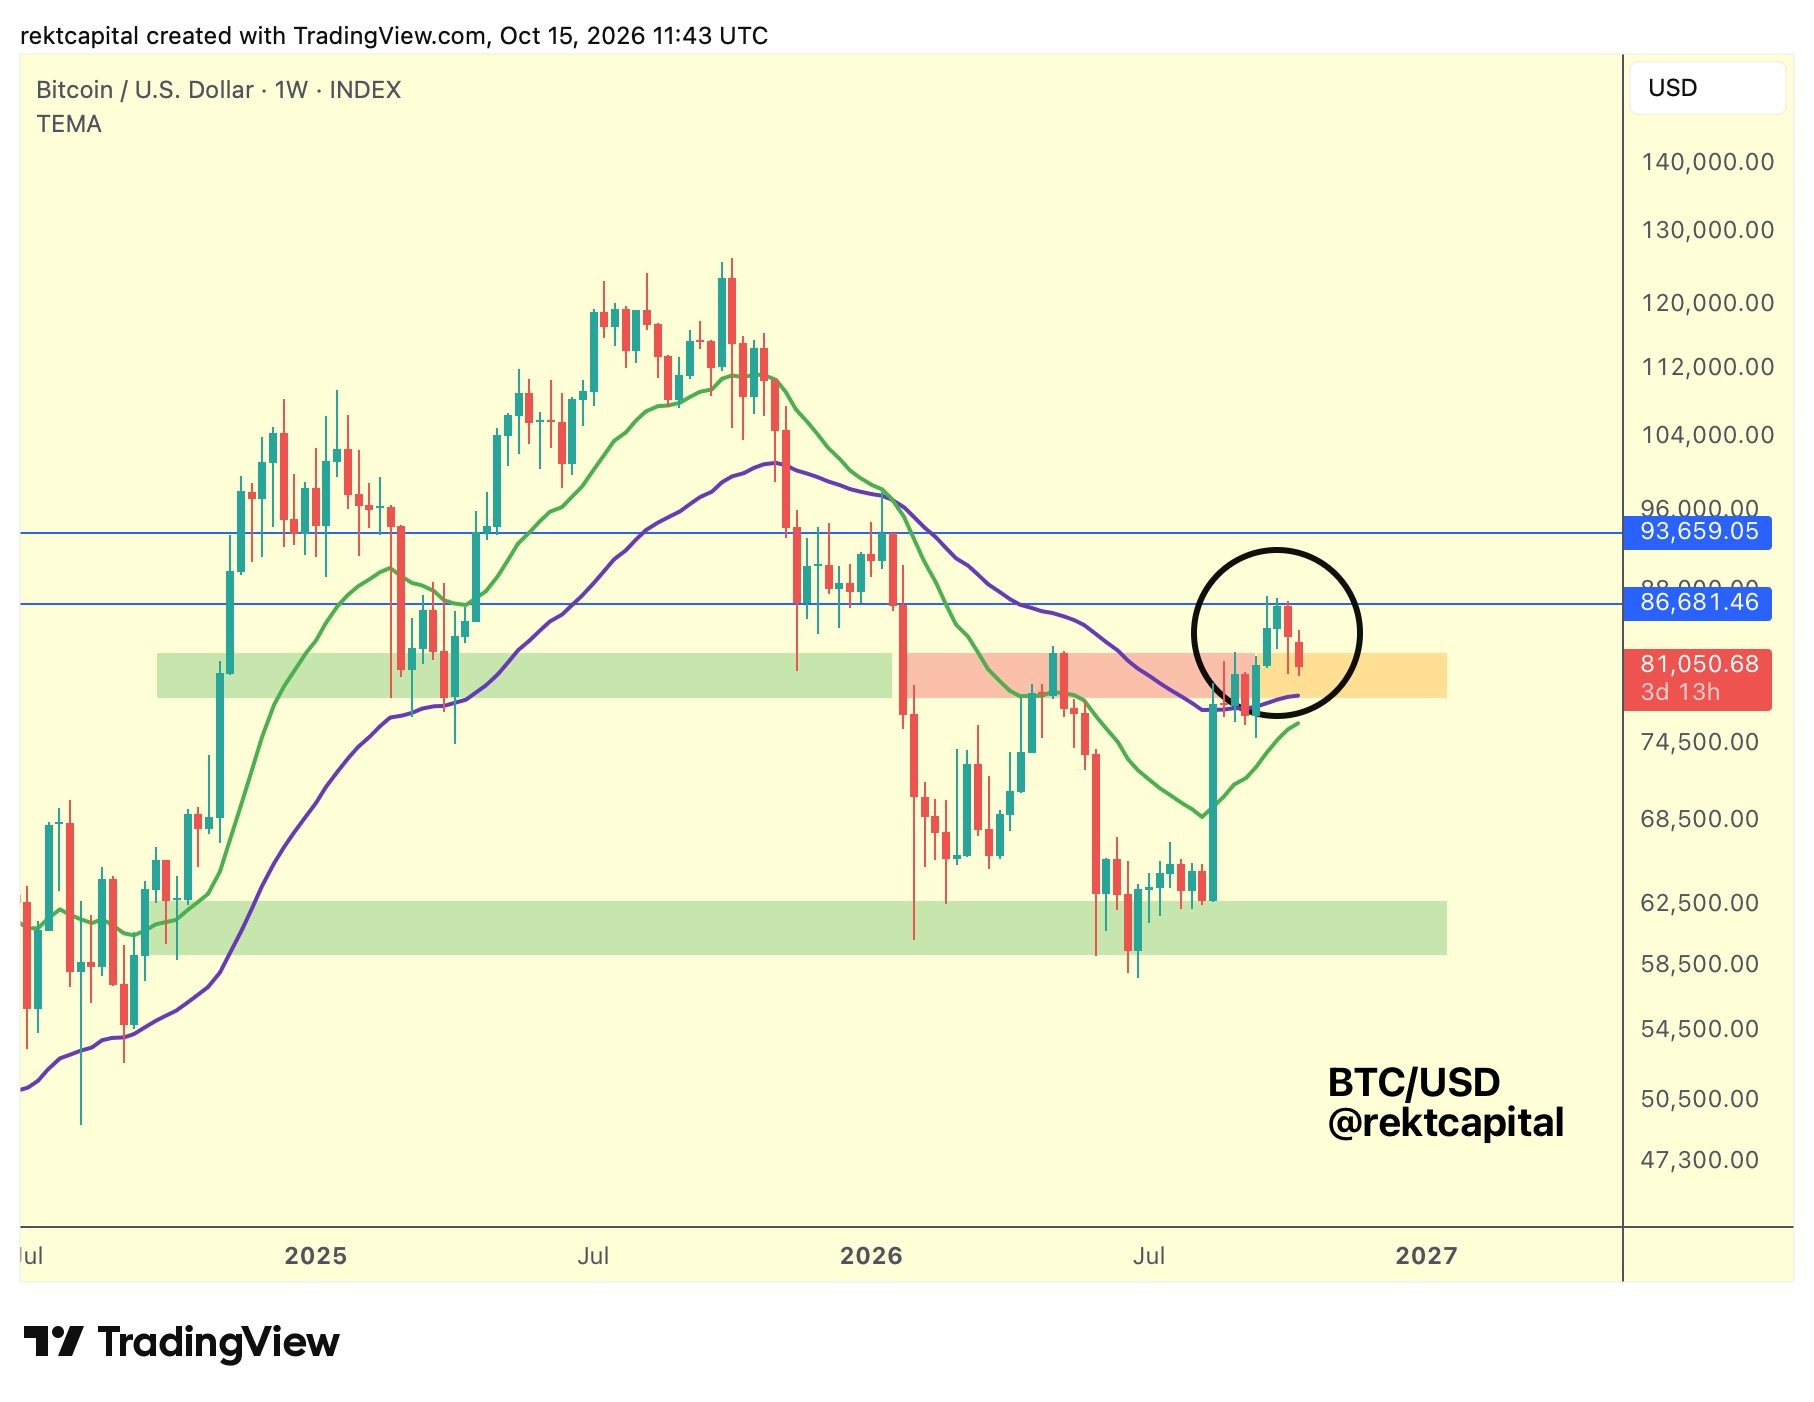
BTC/USD one-week chart. Source: Rekt Capital on X.com
Bitcoin remained below the area between $82,500 and $82,800, a key support zone of interest in recent weeks.
Analyst Aksel Kibar said that Bitcoin’s latest weekly close around $83,700 lacked strength as a breakout.
“A weekly close inside the range can resume wide consolidation between 60K-82.8K 75K can be utilized as the pattern (rectangle bottom reversal) negation level,” he said.
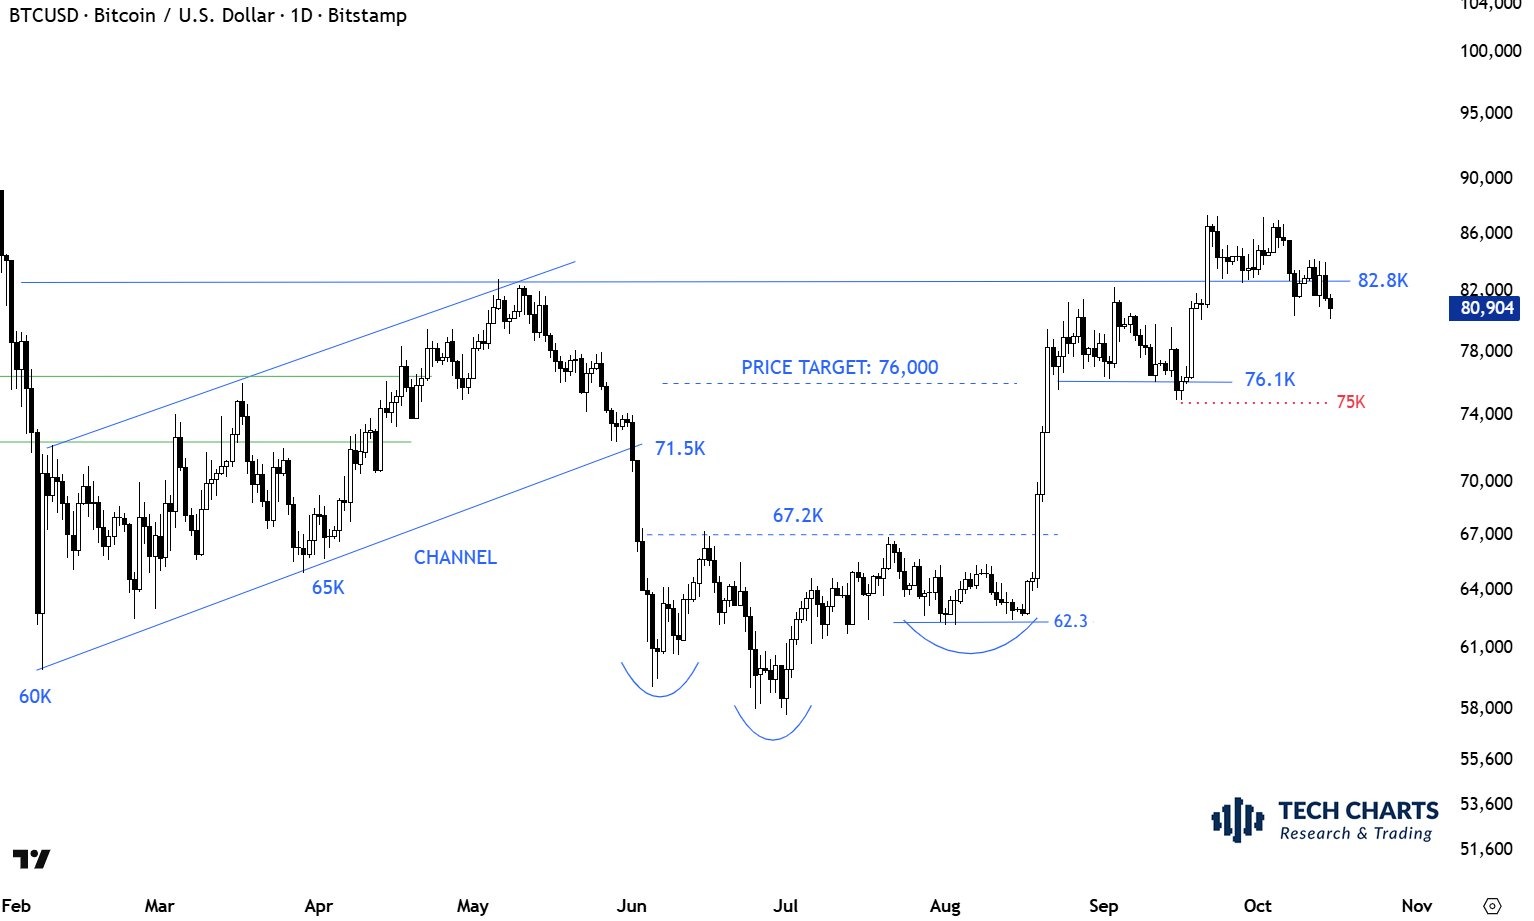
BTC/USD one-day chart. Source: Aksel Kibar on X.com