

Key Takeaways
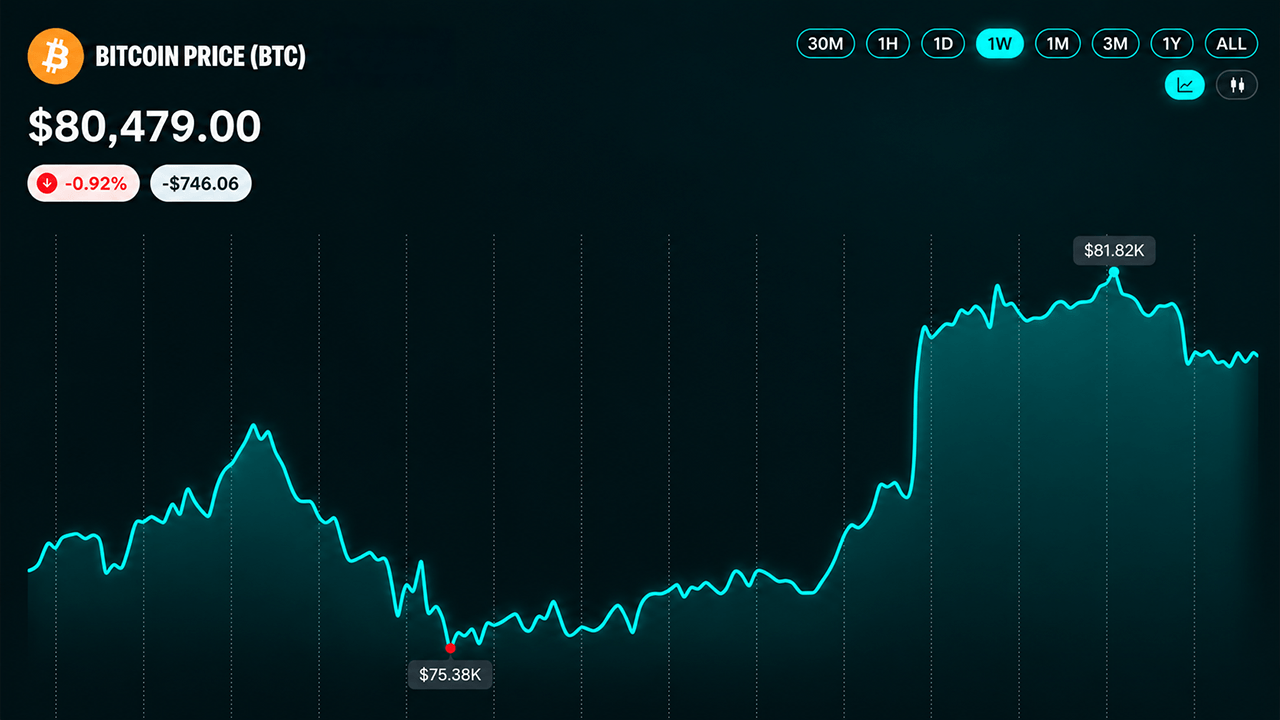
- Bitcoin’s price trades near $80,443 after Sept. 19’s run to $81,914 hit resistance.
- Market data shows 13 of 15 BTC moving averages positive as the daily uptrend holds.
- Bitcoin’s price needs to claim $81,914-$82,833 back, while a break under $80,000 raises downside risk.
1-hour chart: Bitcoin cools off after a $7,000 run
The 1-hour chart shows just how quickly bitcoin’s price changed over the past week. After trading in the mid-$77,000s, BTC got clobbered down to $74,913 on Sept. 16 amid elevated volume, only to grind higher and then kick into high gear on Sept. 18-19, reaching $81,914.
That roughly $7,000 rebound met resistance fast. Sharp red hourly candles dragged the price back toward $80,300 to $80,500, followed by a small-bodied consolidation period. Local support now sits around $80,000 to $80,300, with $79,000 below it, while $81,500 to $81,914 remains the first resistance zone. Until one side gives way, the short-term box is roughly $80,000 to $81,900.
4-hour chart: $82,000 remains the wall BTC cannot clear
Zooming out to the 4-hour chart makes the rejection harder to ignore, but it also shows why calling the broader rebound finished would be premature. Bitcoin’s price climbed from a labeled $63,989 low within the visible Aug. 19-Sept. 20 range to 82,281, pulled back into the mid-76,000s around Sept. 15-16, and then came roaring back for another test near $82,000.
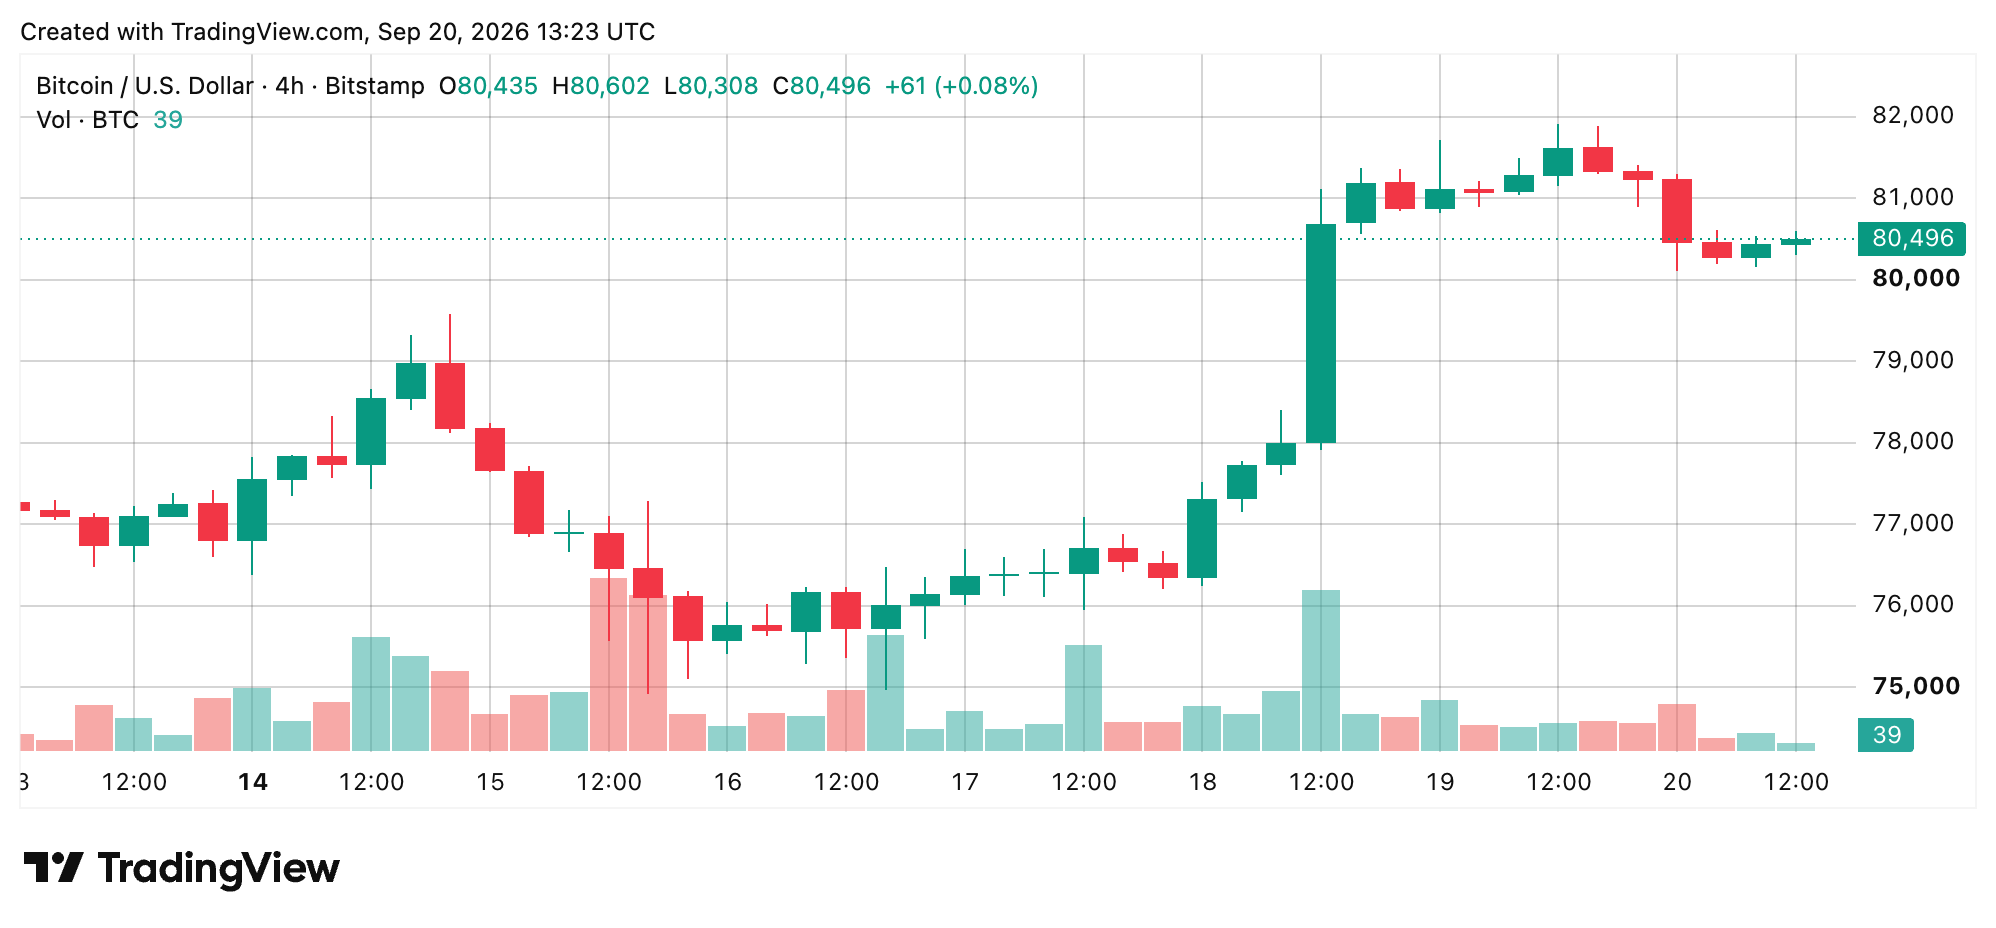
That second attempt also failed to stick, leaving BTC near $80,400. Overhead supply sits between $81,500 and $82,300, while $79,500 to $80,000 is the immediate support zone. A deeper break puts the prior 4-hour swing-low area around $76,000 to $76,500 back on the board.

Daily chart: The bigger uptrend has not broken
The daily chart is where the picture gets more constructive. Bitcoin’s visible structure stretches from a $57,735 low in June or July to a labeled $82,833 high, with price recovering through July and August before returning to the low-82,000s. The latest candles show a pullback from that area, but BTC remains comfortably above the mid-$70,000s base established in August.
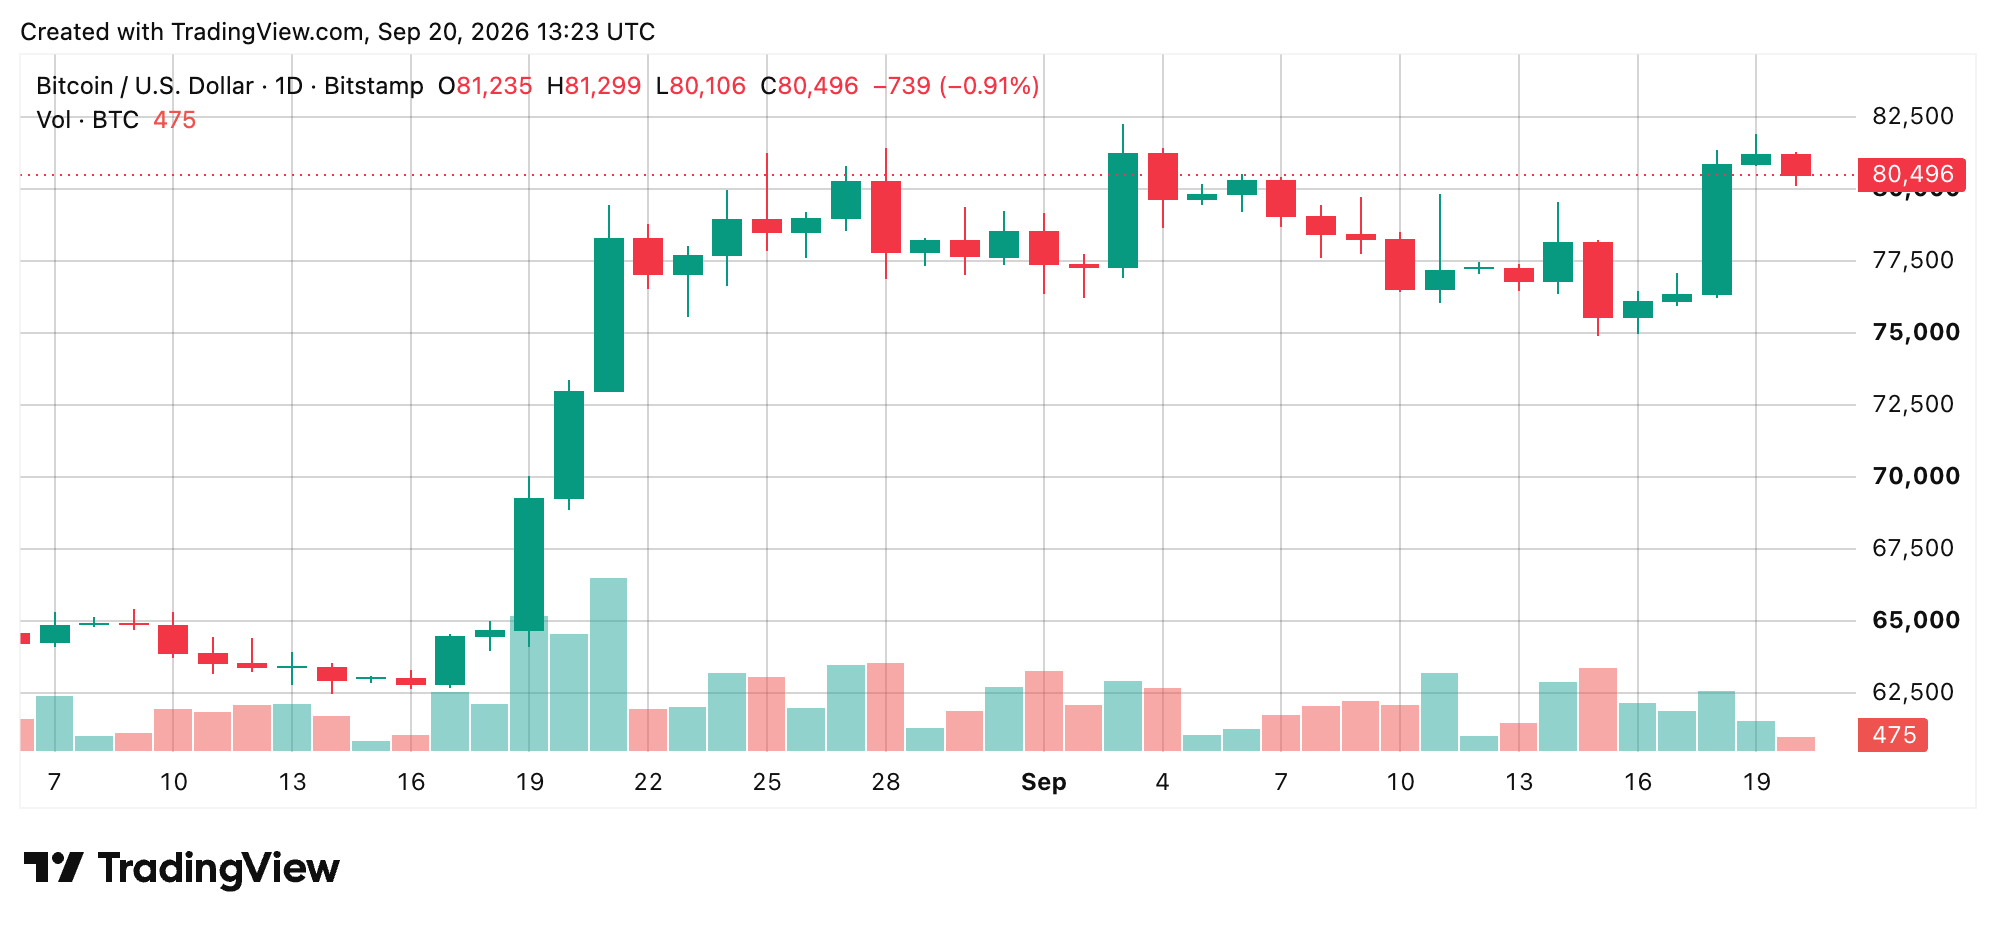
Resistance is clustered between roughly $82,000 and $82,833, while support sits around $76,000 to $78,000. A daily close beneath roughly $76,700, corresponding with the 30-period exponential moving average, would mark the first clear loss of the post-July uptrend structure. For now, that larger structure remains intact.
Oscillators split as momentum sends mixed signals
The daily chart’s oscillator tape is considerably less enthusiastic than the moving averages (MAs). The relative strength index (RSI) stands at 61 and is neutral, while Stochastic (STOCH) at 87 is also impartial despite sitting at an elevated level. The commodity channel index (CCI) at 107 is negative, the average directional index (ADX) at 41 is indifferent, and the awesome oscillator (AO) at 1,235 is also even-handed.
Momentum (MOM) at 3,905 is positive, while the moving average convergence divergence (MACD) level at 1,389 is negative. Stochastic RSI fast (STOCH RSI) at 80, Williams percent range (W%R) at -21, bull bear power (BBP) at 4,385, and the Ultimate oscillator (UO) at 53 are all neutral. Put together, the oscillator group remains neutral, which fits a market consolidating beneath resistance rather than one decisively back in the driver’s seat.
Moving averages keep the larger trend tilted bullish
The moving averages (MAs) tell a much cleaner story. Bitcoin sits above the exponential moving average (EMA) and simple moving average (SMA) across the 10-, 20-, 30-, 50-, 100- and 200-period readings: EMA 10 at $78,755, SMA 10 at $78,016, EMA 20 at $77,882, SMA 20 at $78,416, EMA 30 at $76,710, SMA 30 at $78,409, EMA 50 at $74,485, SMA 50 at $73,194, EMA 100 at $72,007, SMA 100 at $68,279, EMA 200 at $73,350 and SMA 200 at $70,503 are all positive.
The volume weighted moving average (VWMA) at $78,202 is positive, while the Ichimoku baseline (IBL) at $78,597 is neutral. The lone bearish reading is the fast hull moving average (HMA) at $81,075, sitting above BTC’s current price. With 13 of 15 listed moving averages positive, the higher-timeframe structure remains bullish, but reclaiming $81,075 and then $81,914 to $82,833 is the hurdle standing between consolidation and another breakout attempt.
Bull Verdict:
Bitcoin’s broader structure remains bullish with 13 of 15 moving averages positive and price holding above every listed EMA and SMA. A reclaim of $81,075 followed by a break through $81,914-$82,833 would strengthen the rebound and put the bulls firmly back in the driver’s seat.
Bear Verdict:
Short-term momentum has cooled after bitcoin failed to hold the $81,900-$82,300 area, while the HMA and MACD remain negative. Losing $80,000 would weaken the latest bounce, with $79,000 next and the deeper $76,000-$78,000 support zone potentially coming back into play.