


Researchers at the Bank for International Settlements found that estimates of Bitcoin onchain transfer values can vary by as much as sixfold depending on how transactions are measured.
The finding concerns onchain Bitcoin transfer values, rather than trading volume on crypto exchanges. The sixfold gap reflects differences between measurement methods, including how change outputs and other transfers back to the sender are treated.
The discrepancy stems largely from Bitcoin’s transaction structure. When users spend Bitcoin, unspent funds are often returned to the sender as change, which can be counted as another output even though it does not represent funds being transferred to another party.
Breakdown of blockchain records analyzed in the BIS study. Source: BIS

“Metrics such as transaction volumes, market capitalisation and total value locked often suggest a degree of accuracy that is not supported by the nature of the underlying data,” the researchers wrote.
The measurement problem also extends to Bitcoin’s market capitalization. The researchers found that the conventional measure has at times been as much as four times higher than realized capitalization, which values each coin at the price when it last moved.
The study, based on 100 billion blockchain records across Bitcoin, Ethereum and Tron, found that similar measurement challenges extend across the broader crypto ecosystem.
Related: Stablecoins not credible for payments at scale, BIS chief says
Ethereum and stablecoins present additional challenges
Ethereum presented a separate measurement challenge because of the proliferation of smart contracts. Of roughly 67.5 million active contracts examined, about 54 million could not be categorized using the classifications in the study.
Interpreting stablecoin activity presents another challenge, as the same asset can serve different purposes across blockchains. USDT on Ethereum was more closely linked to DeFi activity, while USDT on Tron was associated more with payment-like and store-of-value purposes.
The differences were particularly stark in smart contract holdings. The share of USDT held by smart contracts on Ethereum exceeded 20% in 2022, compared with around 1% on Tron. Because of the different use cases, the researchers said aggregating USDT activity across blockchains can conflate different types of economic activity and obscure how stablecoins are actually being used.
The BIS researchers concluded that onchain indicators should be treated as “noisy approximations rather than direct measures of economic activity.”
Visa filters stablecoin data to reflect economic activity
Some analytics providers already distinguish between raw blockchain activity and adjusted measures intended to better represent economic activity.
Visa’s Onchain Analytics dashboard, powered by data from Allium Labs, displays both total and adjusted stablecoin transaction volumes. Visa says its adjusted methodology aims to remove potential distortions from activity including high-frequency trading, bots, bridge routing and internal exchange operations.
The dashboard currently shows $6.4 trillion in total stablecoin transaction volume across the networks it tracks over the past 30 days, compared with $313.1 billion in adjusted volume.
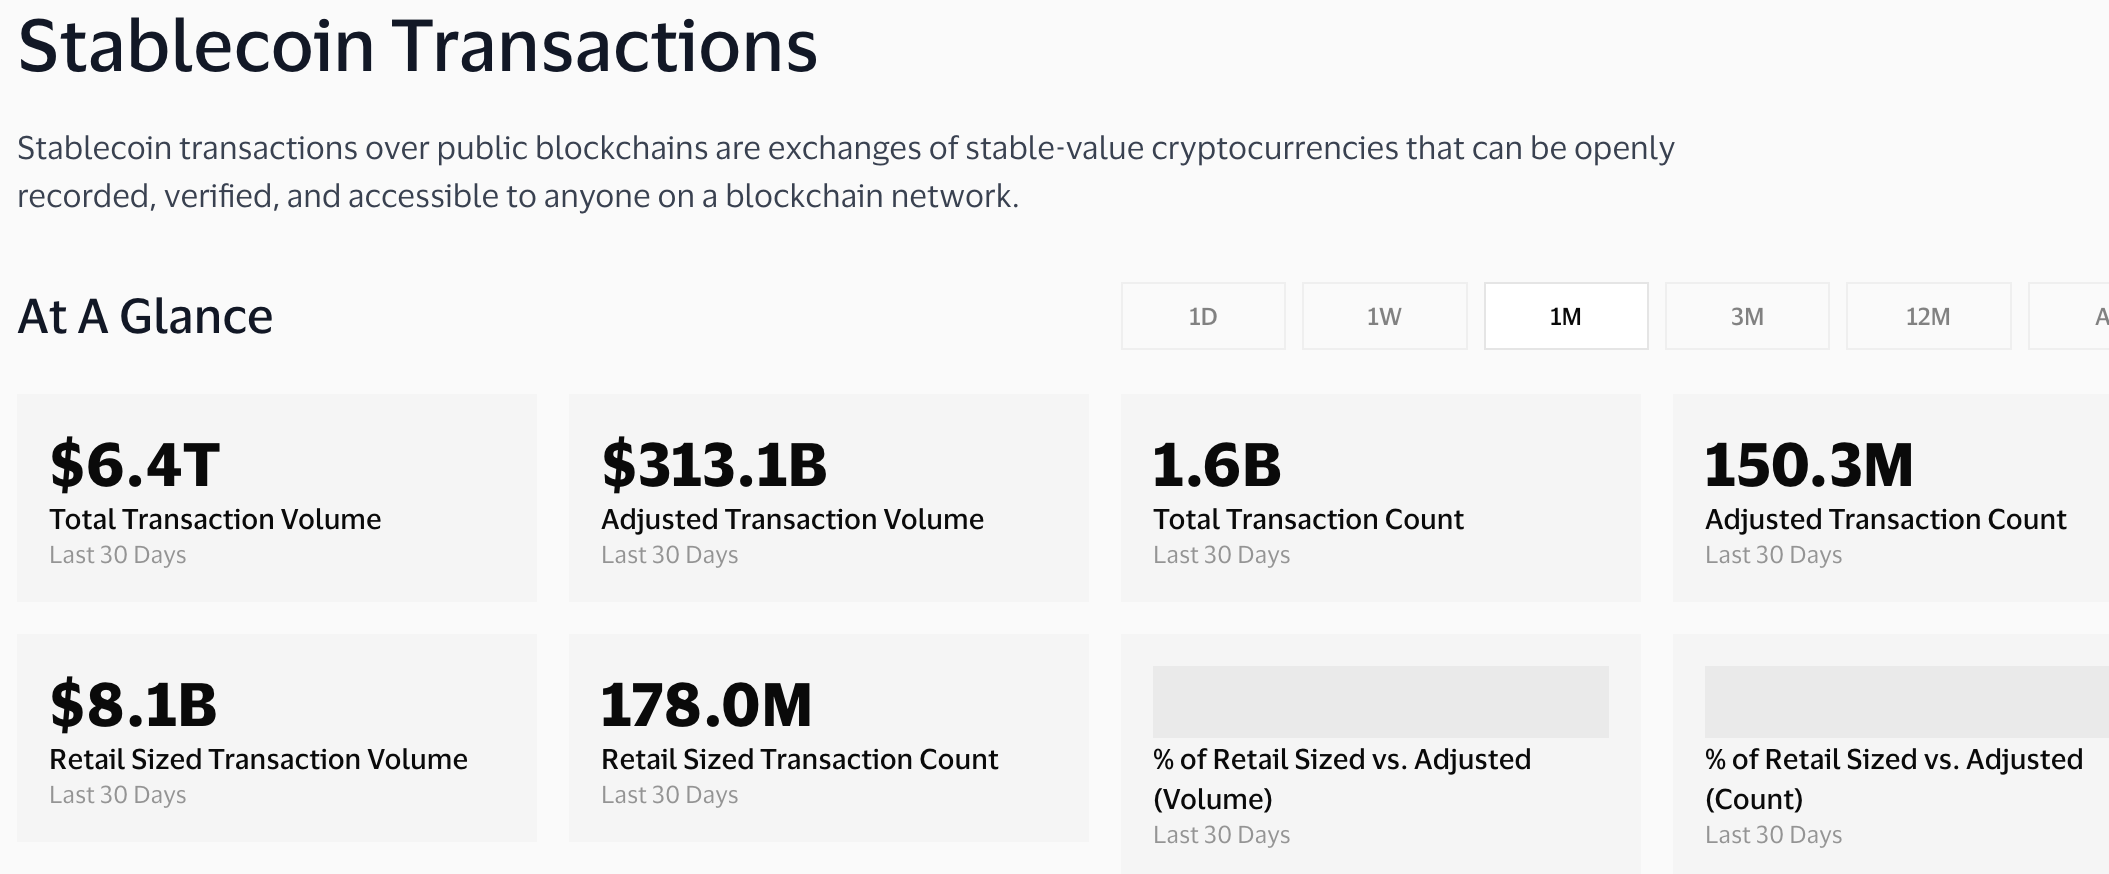
Stablecoin transaction volumes. Source: Visa Onchain Analytics